Introduction
CDKTR (con-duck-tor) is a workflow automation and orchestration system written in pure Rust that is designed to take the complexity out of managing and executing tasks across a distributed system. It is designed to be simple to use, and easy to extend.
Why CDKTR?
The community is awash with different workflow automation and data orchestration tools and platforms, so why was there the need to embark on the (quite frankly) ambitious task to create another one?
CDKTR was designed to solve a problem faced at many businesses which is that a fully centralised workflow automation system is not always the best solution. In many cases, some technical teams only need to automate a few critical jobs, and the overhead of setting up a full-blown workflow automation system is not worth the effort. This is often achieved by using a combination of cron jobs, scripts, and other ad-hoc solutions or running open-source tools like Airflow or Prefect.
Another main driver behind CDKTR's development is the nature of many on-prem and cloud environments which are behind corporate firewalls and have strict security policies. This can make it difficult to use cloud platforms that abstract the server and UI away from the user. Another downside is that these services can come with a fairly hefty price tags which leave teams with little choice but to stand up their own instances of open-source tools which then come with a large maintenance overhead.
To this end CDKTR is and will remain completely open-source and free to use. It designed to work efficiently in a variety of environments from a single node setup to a multi-node cluster.
CDKTR is packaged in a single, small, completely self-contained binary that can be run on any machine even without Rust installed or any other dependencies. This makes it easy to deploy and run in a variety of environments.
What makes it special?
TUI
CDKTR is designed to be fairly low-level in terms of implementation, but high-level in terms of the abstractions it provides. This means that it is easy to extend and modify to suit your needs, but also provides a simple interface for users to interact with. This interface is in the form of a Terminal User Interface (TUI) built with Ratatui which provides a simple way to interact with the system directly from the terminal without having to use or maintain a web interface or other similar tool. This allows teams that usually ssh into their infrastructure to manage and monitor their tasks without having to leave the terminal.
ZeroMQ
CDKTR uses ZeroMQ (a lightning-fast, no-frills messaging library orginally written in C++) as the messaging layer between the different components of the system. This allows for a high degree of flexibility in terms of how the system is deployed and how the different components communicate with each other. It also allows for a high degree of fault tolerance and scalability without sacrificing performance. It also provides its main API in the form of ZeroMQ sockets which allows for easy integration with other systems developed in completely different languages and frameworks.
Rust
CDKTR is written in Rust which provides a much higher degree of safety and performance that is often not found in other (most commonly Python-based) workflow automation tools. It allows for managing tasks at rely on low-latency and instantaneous execution times.
Who is it for?
CDKTR is for developers and technical teams that want a simple, lightweight and scalable way to set up and manage workflow orchestration. I hope you enjoy using it as much as I have enjoyed building it!
Getting Started
This section will guide you through installing cdktr, understanding the basic commands, and creating your first workflow. By the end of this section, you'll have a working cdktr setup and understand the fundamentals of workflow orchestration with cdktr.
What You'll Learn
- How to install cdktr on your system
- Basic CLI commands for managing principals and agents
- How to create and run your first workflow
- How to use the TUI to monitor your workflows
Let's get started!
Installation
cdktr is distributed as a single, self-contained binary with no external dependencies required. This makes installation straightforward on any platform.
Prerequisites
None! cdktr is completely self-contained and doesn't require Rust or any other runtime to be installed.
Installation Methods
From Pre-built Binaries
Pre-built binaries for Linux, macOS, and Windows are available from the GitHub Releases page.
Download the appropriate binary for your platform and add it to your PATH:
# Example for Linux/macOS
chmod +x cdktr
sudo mv cdktr /usr/local/bin/
From Source (Recommended for Development)
If you have Rust installed, you can build cdktr from source:
git clone https://github.com/nicelgueta/cdktr.git
cd cdktr
cargo build --release
The compiled binary will be available at target/release/cdktr.
Verify Installation
Verify that cdktr is installed correctly:
cdktr --version
You should see the version number displayed.
Next Steps
Now that you have cdktr installed, let's explore the Quick Start Guide to get your first workflow running!
Quick Start Guide
This guide will walk you through setting up a basic cdktr system with a principal and agent, and running your first workflow.
Step 1: Initialise a Project
Create a new directory for your cdktr project:
mkdir my-cdktr-project
cd my-cdktr-project
cdktr init
This creates a basic project structure with an example workflow in the workflows/ directory.
Step 2: Start a Principal
The principal is the central coordinator that manages workflow scheduling and task distribution. Start it in one terminal:
cdktr start principal
By default, the principal starts on port 5561. You can specify a different port:
cdktr start principal -p 5570
For light, single-machine setups you can invoke an agent process from the main principal process:
cdktr start principal --with-agent
You should see logs indicating that the principal has started successfully:
[INFO] Principal server started on 127.0.0.1:5555
[INFO] Scheduler found X workflows with active schedules
Step 3: Start an Agent
Agents execute the actual workflow tasks. To start an agent in a new ternminal, run:
cdktr start agent
The agent will automatically connect to the principal running on the default port. If your principal is on a different port or host:
CDKTR_PRINCIPAL_HOST=127.0.0.1 CDKTR_PRINCIPAL_PORT=5570 cdktr start agent
You can specify the maximum number of concurrent workflows an agent can handle:
cdktr start agent --max-concurrent 5
Step 4: Open the TUI
Now that you have a principal and agent running, open the TUI to monitor and manage workflows. The TUI provides a user-friendly interface to interact with your cdktr setup and can be started with:
cdktr ui
The TUI will connect to your principal and display:
- Available workflows
- Workflow execution status
- Registered agents
- Recent activity
What's Next?
You now have a basic cdktr setup running! Here's what to explore next:
- Learn about Basic CLI Commands for managing your setup
- Create Your First Workflow from scratch
- Understand the Architecture & Core Concepts
Configuration
cdktr uses an environment-based configuration system. You can set configuration options via environment variables, a .env file, or in some cases command-line arguments.
All configuration options can be listed using:
cdktr config list
Configuration Options
| Environment Variable | Description | Default Value |
|---|---|---|
CDKTR_LOG_LEVEL | Default log level | INFO |
CDKTR_AGENT_MAX_CONCURRENCY | Maximum number of concurrent workflows an agent can handle | 5 |
CDKTR_RETRY_ATTEMPTS | Number of times to re-attempt a ZMQ request | 20 |
CDKTR_DEFAULT_ZMQ_TIMEOUT_MS | Default timeout for a ZMQ request (milliseconds) | 3000 |
CDKTR_PRINCIPAL_HOST | Hostname of the principal instance | 0.0.0.0 |
CDKTR_PRINCIPAL_PORT | Default port of the principal instance | 5561 |
CDKTR_LOGS_LISTENING_PORT | Listening port for the principal log manager | 5562 |
CDKTR_LOGS_PUBLISHING_PORT | Publishing port for the principal log manager | 5563 |
CDKTR_WORKFLOW_DIR | Default workflow directory | workflows |
CDKTR_WORKFLOW_DIR_REFRESH_FREQUENCY_S | Interval to refresh the workflow directory (seconds) | 60 |
CDKTR_SCHEDULER_START_POLL_FREQUENCY_MS | Interval at which the scheduler checks if a workflow is ready to start (milliseconds) | 500 |
CDKTR_Q_PERSISTENCE_INTERVAL_MS | Task queue persistence interval for principal recovery (milliseconds) | 1000 |
CDKTR_APP_DATA_DIRECTORY | App data directory for cdktr instances | $HOME/.cdktr |
CDKTR_DB_PATH | Path to the main database for the principal instance | $HOME/.cdktr/app.db |
CDKTR_TUI_STATUS_REFRESH_INTERVAL_MS | TUI refresh interval for principal status checks (milliseconds) | 1000 |
CDKTR_AGENT_HEARTBEAT_TIMEOUT_MS | Agent heartbeat timeout - workflows marked as CRASHED if no heartbeat within this duration (milliseconds) | 30000 |
Architecture & Core Concepts
This chapter explains the fundamental architecture of cdktr and the core concepts you need to understand to effectively use the system.
Overview
cdktr is a distributed workflow orchestration system built on a principal-agent architecture. It is designed to be lightweight and scalable, using source-controllable YAML files for workflow definitions, ZeroMQ for fast, reliable communication between components, and DuckDB for storing logs and execution history with powerful query capabilities.
What's Covered
This section explores the key components and patterns that make cdktr work:
- System Overview: The big picture—how components fit together in a distributed pull-based architecture
- Principal: The central coordinator managing workflows, scheduling, work distribution, and persistent state
- Agents: Execution nodes that run tasks in parallel using DAG-based topological sorting
- Event Listeners & Scheduler: The event-driven architecture powering cron scheduling and custom event sources
- Workflows & Tasks: YAML workflow definitions, task types (Subprocess and UvPython), and dependency execution
- Logs & Database: Real-time ZeroMQ log streaming and DuckDB persistence with insert-only audit trails
- Examples: Practical workflow examples demonstrating common patterns
Key Design Principles
- Simplicity: Single binary deployment with no external dependencies
- Performance: Built in Rust for speed and safety
- Distributed: Scale horizontally by adding more agents
- Observable: TUI for real-time monitoring without a web UI
- Flexible: ZeroMQ API allows integration with any language
Let's dive into each concept in detail.
System Overview
cdktr is built on a distributed architecture where a central principal process coordinates work across multiple agents that execute workflows. This design provides both simplicity and scalability—you can run everything on a single machine for development, or distribute agents across multiple machines for production workloads. Workflows are defined in simple YAML files that the principal automatically discovers and loads from the filesystem.
The architecture follows a pull-based model: the principal maintains a queue of workflows ready for execution, and agents poll this queue for work when they have available capacity. This self-regulating design means you can scale horizontally simply by launching more agent processes, without complex load balancing or work distribution logic.
cdktr is completely event-driven. Workflows can be triggered by cron schedules, manual requests via the CLI or TUI, or external event listeners that respond to webhooks, file changes, or any other stimulus you can program. All interactions flow through cdktr's ZeroMQ-based API, which provides a lightweight, high-performance communication layer.
High-Level Architecture
graph TB
    TUI[Terminal UI] --> Principal
    CLI[CLI] --> Principal
    Principal[Principal Server] --> Agent1[Agent 1]
    Principal --> Agent2[Agent 2]
    Principal --> Agent3[Agent N]
    Principal --> DB[(DuckDB)]
    EventListener[Event Listener] --> Principal
    Scheduler[Scheduler] --> EventListener

    Agent1 --> TaskManager1[TaskManager]
    TaskManager1 --> Executor1[Executor 1]
    TaskManager1 --> Executor2[Executor 2]

    style Principal fill:#1b590e,stroke:#333,stroke-width:4px
    style Agent1 fill:#0e9296,stroke:#333,stroke-width:2px
    style Agent2 fill:#0e9296,stroke:#333,stroke-width:2px
    style Agent3 fill:#0e9296,stroke:#333,stroke-width:2px
Core Components
The system comprises several key components that work together to provide distributed workflow orchestration:
Principal
The principal is the system's central coordinator and single source of truth. It manages workflow definitions loaded from YAML files, maintains the global queue of workflows awaiting execution, and tracks the health and status of all registered agents.
The principal runs several background services: a scheduler that triggers workflows based on cron expressions, a log aggregation system that collects and persists execution logs to DuckDB, and a heartbeat monitor that detects failed agents. It also provides the ZeroMQ API server that handles all external communication from the TUI, CLI, agents, and event listeners.
When a workflow needs to execute—whether triggered by schedule, manual request, or external event—the principal adds it to the task queue. Agents poll this queue for work, and the principal assigns workflows on a first-come, first-served basis.
Agents
Agents are autonomous worker processes that execute workflows. Each agent runs independently and can be deployed on the same machine as the principal or on different machines across a network. On startup, an agent registers with the principal and begins polling for available work.
When an agent receives a workflow assignment, its internal task manager analyzes the workflow's dependency graph (DAG) and executes tasks in the correct order. The task manager enables parallel execution of independent tasks, maximizing throughput. As execution progresses, the agent sends continuous status updates back to the principal and streams task output logs.
Agents are self-regulating—they only request work when they have available capacity based on their configured concurrency limits. This design means scaling is as simple as launching additional agent processes.
Scheduler
The integrated scheduler monitors cron expressions defined in workflow files and automatically triggers workflows at their scheduled times. It maintains a priority queue of upcoming executions and checks every 500 milliseconds whether any workflow is due to run.
The scheduler periodically refreshes its view of available workflows (every 60 seconds by default), allowing you to deploy new scheduled workflows without restarting the principal. When a workflow's time arrives, the scheduler triggers it by adding it to the principal's workflow queue, where it awaits assignment to an available agent.
Event Listeners
Event listeners provide the mechanism for external systems to trigger workflow executions. They monitor external events—such as webhooks, file changes, message queues, or any custom trigger—and send workflow execution requests to the principal via the ZeroMQ API.
cdktr doesn't include specific event listener implementations out of the box; instead, it provides the API infrastructure for you to build custom listeners tailored to your needs. Any process that can communicate via ZeroMQ can trigger workflows.
Database
cdktr uses DuckDB, an embedded analytical database, to persist all execution history. Every workflow run, task execution, and log line gets stored in DuckDB, providing a complete audit trail queryable through both the CLI and TUI.
The database schema tracks workflow instances, task executions, status transitions, and detailed logs with timestamps. This persistent history enables debugging failed workflows, generating execution reports, and monitoring system performance over time.
Communication Flow
Workflow Execution Flow
A typical workflow execution follows this sequence:
- Trigger: A workflow is triggered by its cron schedule, manual CLI/TUI request, or external event listener
- Queue: The principal adds the workflow to its global task queue
- Poll: An agent with available capacity polls the principal for work
- Assign: The principal removes the workflow from the queue and sends it to the requesting agent
- Execute: The agent's task manager executes workflow tasks according to their dependencies, launching executors for each task
- Stream Logs: As tasks run, the agent streams stdout/stderr logs to the principal's log manager
- Report Status: The agent sends status updates (PENDING, RUNNING, COMPLETED, FAILED) for each task and the overall workflow
- Persist: The principal stores all status updates and logs in DuckDB for later querying
ZeroMQ Communication Pattern
All components communicate using ZeroMQ's REQ/REP (request/reply) pattern, which provides reliable synchronous messaging:
Client (Agent/TUI/CLI)     Principal Server
        |                          |
        |-------- REQUEST -------->|
        |                          |
        |<------- RESPONSE --------|
        |                          |
This synchronous pattern ensures every request gets a response and provides natural backpressure—if the principal is overloaded, clients wait for a response rather than overwhelming the system with requests.
Logs use a separate PUB/SUB channel where agents publish log messages and the principal subscribes to receive them, enabling high-throughput, non-blocking log streaming.
Scalability Model
cdktr's architecture enables scaling in multiple dimensions:
Horizontal Scaling
Add more agent processes to increase total workflow throughput. Agents can run on the same machine or distributed across multiple machines. Each agent independently polls the principal for work, and the self-regulating design ensures work flows naturally to available capacity.
Since agents only request work when they're ready, there's no need for complex load balancing—agents that finish their workflows quickly will automatically pick up more work.
Vertical Scaling
Increase the max_concurrent_workflows setting on agents to run more workflows simultaneously on powerful machines. Within each workflow, the task manager can execute independent tasks in parallel, making efficient use of multi-core systems.
You can also run the principal on a more powerful machine if you have thousands of workflows or very high throughput requirements, though in practice, the principal is lightweight and can handle substantial load on modest hardware.
Workflow Parallelism
Within a single workflow, the task manager's DAG-based execution model automatically executes independent tasks in parallel. If your workflow has multiple tasks that don't depend on each other, they'll run simultaneously without any special configuration required.
Resilience and Fault Tolerance
cdktr is designed to handle the realities of distributed systems:
Agent Heartbeats: Agents send heartbeats to the principal every 5 seconds. If an agent stops responding (crashed, network partition, machine failure), the principal detects this within 30 seconds and marks any workflows running on that agent as CRASHED.
Buffered Logs: When agents lose connection to the principal, they buffer logs locally and continue executing workflows. When the connection restores, buffered logs are sent to the principal. This prevents log loss during temporary network issues.
Task Queue Persistence: The principal periodically persists its workflow queue to disk. If the principal crashes and restarts, it reloads queued workflows and resumes processing.
Graceful Degradation: If the database becomes unavailable, the principal continues coordinating workflow execution—status updates and logs accumulate in memory until the database recovers.
Workflow Recovery: Failed workflows can be re-triggered manually via the CLI or TUI. The complete execution history in DuckDB helps diagnose what went wrong before retrying.
Next Steps
Now that you understand the overall architecture, dive deeper into specific components:
- Principal - The central coordinator in detail
- Agents - How workflow execution works
- Workflows & Tasks - Defining and structuring work
- ZeroMQ Communication - The messaging layer
Principal
The principal is the brain of the cdktr system. While agents handle the physical execution of workflows, the principal coordinates everything—managing workflow definitions, scheduling executions, tracking agent health, and providing the central API for all system interactions. It's the single source of truth for the state of your distributed workflow system.
What Does the Principal Do?
The principal serves as the central orchestrator with several critical responsibilities:
-
Workflow Management: The principal continuously monitors the workflow directory on the filesystem, loading and parsing YAML workflow definitions. It maintains an in-memory workflow store that gets periodically refreshed (by default, every 60 seconds) to pick up new or modified workflow definitions without requiring a restart. This hot-reload capability makes it trivial to deploy new workflows in CI/CD environments.
-
Intelligent Scheduling: For workflows with cron schedules defined, the principal runs an integrated scheduler that monitors these schedules and automatically triggers workflows at their appointed times. The scheduler uses a priority queue internally to efficiently determine which workflow should execute next, checking every 500 milliseconds whether it's time to launch a workflow.
-
Work Distribution: At its core, the principal maintains a global task queue of workflows ready for execution. When workflows are triggered (either by schedule, manual request, or external event), they're added to this queue. Agents continuously poll the principal for work, and when they request a workflow, the principal pops one from the queue and assigns it to that agent.
-
Agent Lifecycle Management: The principal tracks all registered agents and their health status. When an agent starts up, it registers with the principal and begins sending heartbeats every 5 seconds. The principal runs a dedicated heartbeat monitor that checks for agents that haven't checked in within the timeout period (default: 30 seconds). If an agent times out, the principal automatically marks all workflows running on that agent as CRASHED, preventing them from being stuck in a RUNNING state indefinitely.
-
Persistent State Management: All workflow execution history, task status updates, and logs flow through the principal and get persisted to DuckDB. The principal also periodically persists its task queue to disk (every second by default) so that if the principal crashes and restarts, it can resume processing workflows without losing queued work.
-
API Gateway: The principal exposes a ZeroMQ-based API that serves as the primary interface for the entire system. The TUI, CLI, external event listeners, and agents all communicate with the principal through this API. It handles requests for listing workflows, triggering executions, querying logs, and checking system status.
The Workflow Lifecycle from the Principal's Perspective
Understanding how the principal orchestrates workflow execution helps clarify its role in the system:
1. Workflow Discovery and Loading
On startup and periodically thereafter, the principal scans the configured workflow directory (default: workflows/) and loads all YAML files it finds. Each workflow is parsed, validated, and converted into an internal representation including its DAG structure. Invalid workflows are logged but don't prevent the system from starting.
2. Scheduling and Triggering
For workflows with cron schedules, the scheduler component calculates the next execution time and maintains a priority queue ordered by next run time. When the time arrives, the scheduler triggers the workflow by sending it to the principal's workflow queue. Workflows can also be triggered manually via the CLI or TUI, or by external event listeners.
3. Queue Management
When a workflow is triggered, it enters the principal's global task queue. This queue is the central coordination point—agents don't know what work exists until they ask for it. The principal simply maintains the queue and serves workflows first-come, first-served to agents that request work.
4. Agent Assignment
When an agent polls for work and has available capacity, the principal removes a workflow from the queue and sends it to that agent. The principal records which agent is running which workflow instance, allowing it to track distributed execution across the cluster.
5. Status Tracking
As the agent executes the workflow, it sends status updates back to the principal:
- Workflow started (RUNNING)
- Individual tasks started (PENDING → RUNNING)
- Task completions (COMPLETED or FAILED)
- Final workflow status (COMPLETED, FAILED, or CRASHED)
The principal stores all these updates in DuckDB, building a complete audit trail of execution.
6. Log Aggregation
Task logs generated by agents flow back to the principal via a dedicated ZeroMQ PUB/SUB channel. The principal's log manager receives these messages and queues them for batch insertion into DuckDB every 30 seconds. This approach balances real-time log capture with database write efficiency.
Background Services
The principal runs several background services concurrently:
Admin Refresh Loop
Runs continuously to refresh workflow definitions from disk and persist the task queue state. This ensures that new workflow files are discovered without manual intervention and that the queue survives principal restarts.
Log Manager
Operates two components: a listener that subscribes to log messages from agents via ZeroMQ, and a persistence loop that batches log messages and writes them to DuckDB every 30 seconds. This architecture decouples log collection from database writes, preventing slow database operations from blocking log reception.
Heartbeat Monitor
Continuously scans registered agents, checking when each last sent a heartbeat. If an agent hasn't checked in within the configured timeout, the monitor marks all its running workflows as CRASHED and removes them from the active workflow tracking map.
Scheduler (Optional)
When enabled, the scheduler maintains its own workflow refresh loop and continuously monitors cron schedules to trigger workflows at the right time. The scheduler can be disabled via the --no-scheduler flag for testing or when you want pure manual/event-driven workflow execution.
API Server
The ZeroMQ request/reply server runs continuously, handling incoming API requests from agents, the TUI, CLI, and external systems. All requests are processed synchronously—the server receives a request, processes it, sends a response, then waits for the next request.
High Availability and Recovery
The principal is designed with resilience in mind:
Task Queue Persistence: Every second, the principal serializes its current task queue to disk. If the principal crashes or is restarted, it reloads this state on startup, allowing queued workflows to continue processing without being lost.
Agent Self-Healing: When an agent loses connection to the principal (perhaps due to network issues), it doesn't immediately fail. Instead, it completes any workflows already in progress, buffering logs locally until the principal becomes reachable again. This resilient design prevents cascading failures.
Graceful Degradation: If the database becomes temporarily unavailable, the principal continues operating—workflow execution proceeds, but status updates and logs queue up in memory until the database recovers. This prevents database issues from halting the entire system.
Workflow Refresh: Because workflows are reloaded from disk every minute, you can deploy new workflow definitions while the principal is running. Simply drop new YAML files into the workflow directory, and within a minute, they'll be available for scheduling or manual execution.
Configuration
The principal is configured through environment variables:
CDKTR_PRINCIPAL_HOST: Bind address for the API server (default:0.0.0.0)CDKTR_PRINCIPAL_PORT: API server port (default:5561)CDKTR_WORKFLOW_DIR: Directory to scan for workflow YAML files (default:workflows)CDKTR_DB_PATH: Path to DuckDB database file (default:$HOME/.cdktr/app.db)CDKTR_AGENT_HEARTBEAT_TIMEOUT_MS: How long to wait before marking an agent as timed out (default:30000)
See the Configuration section for a complete list of configuration options.
The Principal is Not a Single Point of Failure
While the principal is the central coordinator, it's designed to minimize the impact of failures. Agents can survive temporary principal outages by completing in-flight work and buffering status updates. When the principal returns, agents re-register and resume normal operation. For production deployments requiring higher availability, you can implement active-passive failover by running a standby principal that takes over if the primary fails, using shared storage for the DuckDB database and task queue persistence files.
Agents
Agents are the workhorses of the cdktr system. While the principal coordinates and schedules workflows, agents are responsible for the actual execution of work. Each agent is an autonomous process that can run on the same machine as the principal or on entirely different machines across a network, providing true distributed workflow execution.
What Does an Agent Do?
At its core, an agent performs three primary functions:
-
Work Acquisition: Agents continuously poll the principal for available workflows using the
FetchWorkflowAPI. When a workflow is available in the principal's task queue, an agent receives it and begins execution. This pull-based model ensures that agents only take on work when they have capacity to handle it. -
Workflow Execution: Once assigned a workflow, the agent executes its tasks according to their dependency graph. The agent manages all aspects of task execution including launching executors, collecting output streams (stdout and stderr), and enforcing concurrency limits.
-
Status Reporting: Throughout the workflow lifecycle, agents send regular updates back to the principal about workflow and task states (PENDING, RUNNING, COMPLETED, FAILED, etc.). This keeps the principal's view of the system synchronized with reality.
Additionally, agents send periodic heartbeats to the principal every 5 seconds to signal they are still alive and ready for work. This heartbeat mechanism allows the principal to detect crashed agents and mark currently running workflows as CRASHED if connections to the agent are lost.
The Internal Task Manager
The heart of every agent is its TaskManager component, which orchestrates the parallel execution of workflow tasks. When an agent receives a workflow from the principal, the TaskManager performs several sophisticated operations to execute it efficiently.
DAG Construction and Topological Ordering
Workflows in cdktr are represented internally as a Directed Acyclic Graph (DAG). Each workflow is converted into a DAG structure that maps task dependencies into graph nodes and edges. The DAG construction validates that there are no circular dependencies that would create deadlocks.
The key innovation here is that the DAG is topologically sorted when loaded into the agent's task tracker component. This topological sort identifies which tasks have no dependencies and can execute immediately—these become the "first tasks" loaded into a ready queue.
Parallel Task Execution
The task manager maintains a ready queue of tasks that have had all their dependencies satisfied and are ready to execute. The aim of this design is that tasks without dependencies on each other can execute in parallel. When a task completes successfully, the task tracker:
- Marks the task as successful
- Examines its dependents in the DAG
- Adds those dependents to the ready queue
- Allows the next iteration of the execution loop to pull from the queue
This means if you have a workflow with three independent data ingestion tasks followed by a merge task, all three ingestion tasks will execute simultaneously, and only when all three complete will the merge task begin.
The agent respects its configured max_concurrent_workflows setting, ensuring it never attempts to run more workflows than it has resources for. Within each workflow, the same concurrency limits apply to individual task execution.
Failure Handling and Cascading Skips
The task tracker implements intelligent failure handling. When a task fails:
- The task is marked as failed
- The tracker traverses the DAG to find all tasks that depend (directly or transitively) on the failed task
- Those dependent tasks are automatically skipped and will not execute
- Tasks with no dependency path to the failed task continue executing normally
This prevents wasted computation on tasks that cannot possibly succeed due to upstream failures, while still allowing independent branches of the workflow DAG to complete successfully.
Resilience and Log Handling
One of cdktr's most robust features is its resilience to temporary network failures or principal unavailability. This is particularly critical for log handling, as tasks may generate significant output that needs to be captured even when the principal is unreachable.
Buffered Log Publishing
Agents publish task logs using a log publisher component that implements a local buffering queue. When a task generates log output:
- The log message is sent to the principal's log listener via ZeroMQ PUB socket
- If the send fails (principal unreachable, network partition, etc.), the message is automatically queued in a local buffer within the agent
- On the next log message, the publisher attempts to clear the buffered messages first
- If the connection has been restored, buffered messages are sent before new ones
This ensures that no log data is lost even during temporary connection issues. Tasks continue executing and their output is preserved locally until the principal becomes reachable again.
Graceful Degradation
When an agent loses connection to the principal during workflow execution, it doesn't immediately crash. Instead:
- The workflow execution loop continues running any in-progress workflows
- Status updates fail to send but the workflow continues executing
- The agent waits for all running workflows to complete their execution
- Only after all workflows have finished does the agent exit with an error
This "complete what you started" philosophy means that temporary principal failures don't cause unnecessary work loss. If a long-running data pipeline is 90% complete when the principal goes down, the agent will finish that last 10% rather than abandoning all progress.
Reconnection Logic
The log publisher includes reconnection logic that recreates ZeroMQ socket connections when they fail. Combined with the local buffering, this means agents can ride out principal restarts or network blips without manual intervention.
Agent Lifecycle
A typical agent lifecycle looks like this:
- Startup: Agent creates its task manager with a unique instance ID
- Registration: Agent registers with the principal
- Heartbeat: Background task spawns to send heartbeats every 5 seconds
- Work Loop: Agent enters its main workflow execution loop, continuously polling for work
- Workflow Acquisition: When work is available, agent receives a workflow
- Execution: Workflow tasks execute in parallel according to DAG dependencies
- Completion: Final workflow status sent to principal, workflow counter decremented
- Repeat: Agent returns to polling for more work
This continues indefinitely until the agent is explicitly shut down or loses connection to the principal in an unrecoverable way.
Configuration
Agents are configured primarily through the CDKTR_AGENT_MAX_CONCURRENCY environment variable (default: 5), which controls how many workflows an agent can execute simultaneously. Higher values allow more parallelism but consume more system resources.
Agents also respect the general ZeroMQ configuration settings like CDKTR_RETRY_ATTEMPTS and CDKTR_DEFAULT_ZMQ_TIMEOUT_MS when communicating with the principal.
Horizontal Scaling
The beauty of cdktr's agent architecture is how trivially it scales horizontally. To handle more workflow throughput:
- Launch additional agent processes on the same or different machines
- Point them at the same principal using
CDKTR_PRINCIPAL_HOSTandCDKTR_PRINCIPAL_PORT - Each agent automatically registers and begins polling for work
Agents only request work from the principal when they have available capacity (i.e., they haven't hit their concurrency limits). This self-regulating behavior means work naturally flows to available agents without requiring complex load balancing logic in the principal.
This means you can scale from a single-machine development setup to a distributed production cluster without changing a single line of configuration—just launch more agents.
Event Listeners & Scheduler
cdktr is fundamentally an event-driven system. Unlike traditional workflow engines that might poll databases or rely on fixed schedules alone, cdktr treats everything—including scheduled executions—as events. Workflows are triggered by events, whether those events are time-based (cron schedules), user-initiated (CLI commands), or custom external triggers (webhooks, file changes, message queues, etc.).
This event-driven architecture provides tremendous flexibility. The same workflow can be triggered by a cron schedule during regular business hours and also triggered on-demand when a webhook receives a deployment notification. There's no special configuration needed—workflows simply respond to whatever events you send their way.
The Event-Driven Philosophy
In cdktr, an event is anything that says "run this workflow now." Events flow into the principal via its ZeroMQ API, and the principal's response is always the same: add the requested workflow to the task queue. The event source doesn't need to know or care about agents, task execution, or DAGs—it simply says "please run workflow X" and the system handles the rest.
This decoupling is powerful. Your event sources can be simple Python scripts, complex monitoring systems, CI/CD pipelines, or even other workflow engines. As long as they can send a ZeroMQ message, they can trigger cdktr workflows.
The Scheduler: An Event Listener Implementation
The integrated scheduler is cdktr's canonical example of an event listener. It monitors cron expressions defined in workflow YAML files and triggers those workflows at the appointed times. But here's the key insight: the scheduler is itself just an implementation of cdktr's event listener interface.
The scheduler doesn't get special treatment from the principal. It communicates through the same ZeroMQ API that external event listeners use. When a workflow's scheduled time arrives, the scheduler sends a workflow execution request to the principal, just like any other event source would.
How the Scheduler Works
On startup, the scheduler:
- Queries the principal for all workflows via the ZeroMQ API
- Filters to only those with valid cron expressions
- Calculates the next execution time for each scheduled workflow
- Builds a priority queue ordered by next execution time
The scheduler then enters its event loop:
- Checks if the next workflow in the priority queue is ready to run (current time >= scheduled time)
- If not ready, sleeps for 500 milliseconds and checks again
- When a workflow is ready, sends a workflow execution request to the principal
- Calculates when that workflow should run next and re-adds it to the priority queue
- Repeats indefinitely
The scheduler runs a background refresh loop that queries the principal every 60 seconds for workflow definitions. If new workflows appear or existing ones change, the scheduler updates its internal priority queue accordingly. This means you can deploy new scheduled workflows without restarting the principal—they'll be picked up automatically within a minute.
Graceful Degradation
If no workflows have cron schedules defined, the scheduler simply doesn't start. The principal continues operating normally, handling manual workflow triggers and external events. The scheduler is truly optional.
Creating Custom Event Listeners
The real power of cdktr's event-driven architecture emerges when you create custom event listeners tailored to your specific needs. cdktr provides two primary ways to build event listeners: native implementations in Rust, and external implementations in Python (or any language that can speak ZeroMQ).
Event Listeners in Rust
For high-performance, tightly-integrated event listeners, you can implement the EventListener trait in Rust. This trait defines a simple contract:
#![allow(unused)]
fn main() {
#[async_trait]
pub trait EventListener<T> {
    async fn start_listening(&mut self) -> Result<(), GenericError>;
    async fn run_workflow(&mut self, workflow_id: &str) -> Result<(), GenericError>;
}
}
The start_listening() method is where your event detection logic lives. It typically runs in an infinite loop, waiting for events to occur. When an event happens that should trigger a workflow, you call run_workflow() with the workflow ID, and the trait provides a default implementation that sends the execution request to the principal via ZeroMQ.
Example: File Watcher Event Listener
Here's how you might implement a file watcher that triggers workflows when files change:
#![allow(unused)]
fn main() {
use async_trait::async_trait;
use cdktr_events::EventListener;
use notify::{Watcher, RecursiveMode, Event};
use std::sync::mpsc;

pub struct FileWatcherListener {
    watch_path: String,
    workflow_id: String,
}

#[async_trait]
impl EventListener<Event> for FileWatcherListener {
    async fn start_listening(&mut self) -> Result<(), GenericError> {
        let (tx, rx) = mpsc::channel();
        let mut watcher = notify::recommended_watcher(tx)?;

        watcher.watch(Path::new(&self.watch_path), RecursiveMode::Recursive)?;

        loop {
            match rx.recv() {
                Ok(Ok(event)) => {
                    if event.kind.is_modify() {
                        info!("File modified: {:?}, triggering workflow", event.paths);
                        self.run_workflow(&self.workflow_id).await?;
                    }
                }
                Ok(Err(e)) => error!("Watch error: {:?}", e),
                Err(e) => error!("Channel error: {:?}", e),
            }
        }
    }
}
}
This listener watches a directory for file changes and triggers a workflow whenever a modification occurs. The run_workflow() call handles all the ZeroMQ communication with the principal.
Event Listeners in Python (python-cdktr)
For teams more comfortable with Python, or for rapid prototyping, cdktr provides the python-cdktr library. This library offers a Python interface to cdktr's ZeroMQ API, making it trivial to build event listeners without writing any Rust code.
Example: Webhook Event Listener
Here's a Python event listener that triggers workflows in response to HTTP webhooks:
from cdktr import EventListener, Principal
from flask import Flask, request
import threading

class WebhookListener(EventListener):
    def __init__(self, principal_host="localhost", principal_port=5561):
        self.principal = Principal(host=principal_host, port=principal_port)
        self.app = Flask(__name__)
        self.setup_routes()

    def setup_routes(self):
        @self.app.route('/trigger/<workflow_id>', methods=['POST'])
        def trigger_workflow(workflow_id):
            payload = request.get_json()
            result = self.run_workflow(workflow_id)
            if result.success:
                return {"status": "triggered", "workflow": workflow_id}, 200
            else:
                return {"status": "failed", "error": result.error}, 500

    def start_listening(self):
        """Start the Flask webhook server"""
        self.app.run(host='0.0.0.0', port=8080)

if __name__ == "__main__":
    listener = WebhookListener()
    listener.start_listening()
This creates an HTTP endpoint at /trigger/<workflow_id> that accepts POST requests. When a request arrives, it triggers the specified workflow via the cdktr principal.
Example: Message Queue Event Listener
Here's a listener that consumes messages from RabbitMQ and triggers workflows:
from cdktr import EventListener, Principal
import pika
import json

class RabbitMQListener(EventListener):
    def __init__(self, rabbitmq_host='localhost', queue_name='cdktr-workflows',
                 principal_host='localhost', principal_port=5561):
        self.principal = Principal(host=principal_host, port=principal_port)
        self.rabbitmq_host = rabbitmq_host
        self.queue_name = queue_name

    def handle_message(self, ch, method, properties, body):
        """Callback for each RabbitMQ message"""
        try:
            message = json.loads(body)
            workflow_id = message.get('workflow_id')

            if workflow_id:
                result = self.run_workflow(workflow_id)
                if result.success:
                    ch.basic_ack(delivery_tag=method.delivery_tag)
                else:
                    ch.basic_nack(delivery_tag=method.delivery_tag, requeue=True)
        except Exception as e:
            print(f"Error processing message: {e}")
            ch.basic_nack(delivery_tag=method.delivery_tag, requeue=True)

    def start_listening(self):
        """Start consuming from RabbitMQ"""
        connection = pika.BlockingConnection(
            pika.ConnectionParameters(host=self.rabbitmq_host)
        )
        channel = connection.channel()
        channel.queue_declare(queue=self.queue_name, durable=True)

        channel.basic_qos(prefetch_count=1)
        channel.basic_consume(
            queue=self.queue_name,
            on_message_callback=self.handle_message
        )

        print(f"Listening for workflow triggers on queue: {self.queue_name}")
        channel.start_consuming()

if __name__ == "__main__":
    listener = RabbitMQListener()
    listener.start_listening()
Example: Database Change Listener
Monitor a PostgreSQL database for changes and trigger workflows:
from cdktr import EventListener, Principal
import psycopg2
from psycopg2.extensions import ISOLATION_LEVEL_AUTOCOMMIT
import select
import time

class DatabaseChangeListener(EventListener):
    def __init__(self, db_connection_string, channel_name='workflow_triggers',
                 principal_host='localhost', principal_port=5561):
        self.principal = Principal(host=principal_host, port=principal_port)
        self.db_connection_string = db_connection_string
        self.channel_name = channel_name

    def start_listening(self):
        """Listen for PostgreSQL NOTIFY events"""
        conn = psycopg2.connect(self.db_connection_string)
        conn.set_isolation_level(ISOLATION_LEVEL_AUTOCOMMIT)

        cursor = conn.cursor()
        cursor.execute(f"LISTEN {self.channel_name};")

        print(f"Listening for notifications on channel: {self.channel_name}")

        while True:
            if select.select([conn], [], [], 5) == ([], [], []):
                continue
            else:
                conn.poll()
                while conn.notifies:
                    notify = conn.notifies.pop(0)
                    workflow_id = notify.payload
                    print(f"Received notification: {workflow_id}")
                    self.run_workflow(workflow_id)

if __name__ == "__main__":
    listener = DatabaseChangeListener(
        db_connection_string="postgresql://user:pass@localhost/mydb"
    )
    listener.start_listening()
The EventListener Base Class
The python-cdktr library provides an EventListener base class that handles the ZeroMQ communication for you:
from cdktr import EventListener

class MyCustomListener(EventListener):
    def run_workflow(self, workflow_id: str) -> Result:
        """
        Trigger a workflow on the cdktr principal.
        Returns a Result object with .success and .error attributes.
        """
        # Implemented by the base class - just call it!
        return super().run_workflow(workflow_id)

    def start_listening(self):
        """
        Your event detection logic goes here.
        Call self.run_workflow(workflow_id) whenever an event occurs.
        """
        raise NotImplementedError("Subclasses must implement start_listening()")
Real-World Event Listener Scenarios
Event listeners enable powerful workflow orchestration patterns:
CI/CD Integration: Deploy code, send a webhook to trigger a cdktr workflow that runs tests, migrations, and health checks.
Data Pipeline Triggers: When new data lands in S3, trigger a workflow that processes, validates, and loads it into your warehouse.
Monitoring and Alerting: When your monitoring system detects an anomaly, trigger a remediation workflow that attempts automatic fixes and notifies the team.
User Actions: When a user performs a specific action in your application, trigger a workflow that sends emails, updates analytics, and logs to your data warehouse.
Cross-System Orchestration: Use event listeners to bridge different systems—when System A completes a task, trigger a cdktr workflow that kicks off related work in System B.
Configuration and Deployment
Event listeners are separate processes from the principal and agents. You deploy them alongside your cdktr infrastructure:
Development: Run event listeners in the same terminal or IDE where you're running the principal, useful for testing and debugging.
Production: Deploy event listeners as systemd services, Docker containers, or Kubernetes pods, ensuring they have network connectivity to the principal's ZeroMQ port.
Event listeners should be treated as first-class components of your workflow infrastructure, with proper monitoring, logging, and error handling.
The Power of Events
By treating everything as events, cdktr provides a unified model for workflow triggering. Whether a workflow runs at 3 AM every day via the scheduler, gets triggered by a deployment webhook, or responds to a file change, the execution path is identical. This consistency makes cdktr predictable and easy to reason about, while the extensibility of the event listener interface ensures you're never locked into a predefined set of trigger types.
Workflows & Tasks
Workflows and tasks are the fundamental building blocks of automation in cdktr. A workflow is a collection of related tasks that execute together as a coordinated unit, with tasks running in an order determined by their dependencies.
What is a Workflow?
A workflow represents a complete automation process—a series of steps that together accomplish a specific goal. Think of it as a recipe: it has a name, a description of what it does, and a list of steps (tasks) to execute. Workflows can run on a schedule, be triggered manually, or respond to external events.
Workflows are defined in YAML files stored in the workflow directory (default: workflows/). This file-based approach provides powerful benefits:
Source Control: YAML files live alongside your code in Git or other version control systems. You track changes, review pull requests for workflow modifications, and maintain a complete history of your automation evolution.
GitOps Workflows: Deploy workflow changes through your CI/CD pipeline. When you merge a pull request that modifies a workflow YAML file, the changes automatically take effect without manual intervention.
Hot Reload: The principal refreshes workflows from disk every 60 seconds (configurable via CDKTR_WORKFLOW_DIR_REFRESH_FREQUENCY_S). Drop a new YAML file into the workflows directory, and within a minute it's loaded and available for scheduling or manual execution—no restarts required. This makes cdktr particularly well-suited for dynamic environments where workflows are frequently added or modified.
Declarative Configuration: YAML's human-readable format makes workflows self-documenting. Anyone can read a workflow file and understand what it does, when it runs, and how tasks depend on each other.
Workflow Structure
Here's a complete workflow example:
name: Data Pipeline
description: Extract, transform, and load customer data
cron: "0 0 2 * * *"  # Run daily at 2 AM
start_time: 2025-01-20T02:00:00+00:00  # Optional: delayed first run

tasks:
  extract:
    name: Extract Customer Data
    description: Pull data from production database
    config:
      !Subprocess
      cmd: python
      args: ["scripts/extract.py", "--table", "customers"]

  transform:
    name: Transform Data
    description: Clean and normalize extracted data
    depends: ["extract"]
    config:
      !UvPython
      script_path: scripts/transform.py
      packages:
        - pandas>=2.3.1
        - numpy>=1.26.0

  load:
    name: Load to Warehouse
    description: Upload transformed data to data warehouse
    depends: ["transform"]
    config:
      !Subprocess
      cmd: bash
      args: ["scripts/load.sh", "/tmp/transformed_data.csv"]
Workflow Properties
name (required): A human-readable name for the workflow. Displayed in the TUI and CLI.
description (optional): Explains what the workflow does and why it exists. Good descriptions make workflows self-documenting.
cron (optional): A cron expression defining when the workflow should run automatically. Uses standard cron syntax with seconds precision (seconds minutes hours day month weekday). Omit this field for workflows that should only be triggered manually or by external events.
start_time (optional): An ISO 8601 timestamp indicating when the workflow should first become active. If specified with a cron schedule, the workflow won't trigger before this time even if the cron expression matches. Useful for staging workflows that shouldn't run until a specific deployment date.
tasks (required): A map of task definitions. Each key is a unique task identifier used for dependency declarations.
What is a Task?
A task is a single unit of executable work. While workflows coordinate multiple steps, tasks represent individual actions: run a Python script, execute a database query, make an HTTP request, or trigger an external system.
Tasks are where the actual work happens. When an agent receives a workflow, it executes tasks one by one (or in parallel when dependencies allow), streaming logs back to the principal and reporting status as each task completes.
Task Structure
task_identifier:
  name: Human Readable Task Name
  description: What this task does
  depends: ["other_task", "another_task"]  # Optional
  config:
    !Subprocess  # or !UvPython
    cmd: command
    args: ["arg1", "arg2"]
Task Properties
name (required): A descriptive name for the task, shown in logs and the TUI.
description (optional): Documents the task's purpose and behavior.
depends (optional): A list of task identifiers that must complete successfully before this task runs. This field defines the workflow's dependency graph.
config (required): The executable configuration specifying what to run and how to run it.
Task Types
cdktr provides two task types optimized for different use cases:
Subprocess Tasks
Subprocess tasks execute any command as a separate process. This is the most flexible task type—anything you can run in a terminal, you can run as a Subprocess task.
config:
  !Subprocess
  cmd: <executable>     # Command name in PATH or absolute path
  args:                 # Optional: command arguments as list
    - <arg1>
    - <arg2>
Common Examples:
Shell Scripts
config:
  !Subprocess
  cmd: bash
  args: ["./deploy.sh", "production"]
Python Scripts
config:
  !Subprocess
  cmd: python
  args: ["analysis.py", "--date", "2025-01-20"]
Database Operations
config:
  !Subprocess
  cmd: psql
  args: ["-h", "localhost", "-c", "VACUUM ANALYZE;"]
HTTP Requests
config:
  !Subprocess
  cmd: curl
  args: ["-X", "POST", "-H", "Content-Type: application/json",
         "https://api.example.com/webhook", "-d", '{"status":"complete"}']
UvPython Tasks
UvPython tasks run Python scripts with automatic dependency management via uv, Astral's fast Python package manager. This task type eliminates the need to pre-install dependencies or manage virtual environments—just specify the packages your script needs, and uv handles the rest.
config:
  !UvPython
  script_path: <path_to_script>           # Required
  packages:                               # Optional: dependencies
    - package>=version
  is_uv_project: <true|false>            # Optional: default false
  working_directory: <path>              # Optional: execution directory
  uv_path: <path_to_uv>                  # Optional: custom uv binary
Standalone Script with Dependencies
Perfect for scripts that need specific packages but aren't part of a larger project:
config:
  !UvPython
  script_path: ./process_data.py
  packages:
    - pandas>=2.3.1,<3.0.0
    - requests>=2.31.0
    - scipy>=1.11.0
When this task runs, uv automatically installs the specified packages in an isolated environment and executes the script.
uv Project
For scripts that are part of a uv project with a pyproject.toml file or inline dependencies (PEP 723):
config:
  !UvPython
  script_path: ./analysis.py
  is_uv_project: true
  working_directory: ./data-pipeline
Inline Dependencies (PEP 723)
Python scripts can declare dependencies inline using PEP 723 syntax:
# /// script
# dependencies = [
#   "pandas>=2.3.1",
#   "httpx>=0.25.0",
# ]
# ///

import pandas as pd
import httpx

# Your script logic here
Use is_uv_project: true to leverage these inline dependencies:
config:
  !UvPython
  script_path: ./fetch_and_process.py
  is_uv_project: true
Task Dependencies and Execution Order
Tasks declare dependencies using the depends field. This creates a directed acyclic graph (DAG) that determines execution order:
tasks:
  fetch_data:
    name: Fetch Raw Data
    config:
      !Subprocess
      cmd: python
      args: ["fetch.py"]

  validate:
    name: Validate Data Quality
    depends: ["fetch_data"]
    config:
      !UvPython
      script_path: validate.py
      packages: ["great-expectations>=0.18.0"]

  process:
    name: Process and Transform
    depends: ["validate"]
    config:
      !UvPython
      script_path: transform.py
      is_uv_project: true

  report:
    name: Generate Report
    depends: ["process"]
    config:
      !Subprocess
      cmd: python
      args: ["report.py", "--output", "daily_report.pdf"]
This creates a linear pipeline: fetch_data → validate → process → report.
Parallel Execution
Tasks without dependencies on each other execute in parallel:
tasks:
  fetch_customers:
    name: Fetch Customer Data
    config:
      !Subprocess
      cmd: python
      args: ["fetch.py", "--table", "customers"]

  fetch_orders:
    name: Fetch Order Data
    config:
      !Subprocess
      cmd: python
      args: ["fetch.py", "--table", "orders"]

  fetch_products:
    name: Fetch Product Data
    config:
      !Subprocess
      cmd: python
      args: ["fetch.py", "--table", "products"]

  merge:
    name: Merge All Data
    depends: ["fetch_customers", "fetch_orders", "fetch_products"]
    config:
      !UvPython
      script_path: merge.py
      packages: ["pandas>=2.3.1"]
Here, the three fetch tasks run simultaneously, and the merge task only starts after all three complete successfully.
Failure Handling
If a task fails, cdktr automatically skips all tasks that depend on it (directly or transitively). However, tasks in independent branches of the DAG continue executing:
tasks:
  task_a:
    name: Independent Task A
    config:
      !Subprocess
      cmd: echo
      args: ["Task A runs regardless"]

  task_b:
    name: Task B
    config:
      !Subprocess
      cmd: false  # This will fail
      args: []

  task_c:
    name: Depends on B
    depends: ["task_b"]
    config:
      !Subprocess
      cmd: echo
      args: ["This gets skipped because task_b failed"]

  task_d:
    name: Independent Task D
    config:
      !Subprocess
      cmd: echo
      args: ["Task D runs regardless"]
If task_b fails, task_c is automatically skipped, but task_a and task_d execute normally.
Workflow Deployment and Version Control
The real power of YAML-based workflows emerges when you treat them as code:
1. Store workflows in Git alongside your application code. Workflow changes go through the same review process as code changes.
2. Deploy via CI/CD: Your deployment pipeline can update workflow definitions by copying new YAML files to the workflow directory on your cdktr principal server.
3. Automatic updates: Within 60 seconds (configurable), the principal detects the new or modified workflows and reloads them. No service restarts, no manual intervention.
4. Gradual rollouts: Test new workflows in development, promote to staging, then production—all through version-controlled YAML files.
This workflow-as-code approach means your automation infrastructure evolves alongside your application, with the same safety nets (code review, testing, gradual rollouts) that protect your production systems.
DAG Construction
cdktr automatically builds a directed acyclic graph (DAG) from task dependencies:
graph TD
    extract[Extract Data] --> transform[Transform Data]
    transform --> load[Load Data]
Parallel Execution
Tasks without dependencies or with satisfied dependencies can run in parallel:
tasks:
  fetch_api_1:
    name: Fetch from API 1
    config:
      !Subprocess
      cmd: curl
      args: ["https://api1.example.com/data"]

  fetch_api_2:
    name: Fetch from API 2
    config:
      !Subprocess
      cmd: curl
      args: ["https://api2.example.com/data"]

  combine:
    name: Combine Results
    depends: ["fetch_api_1", "fetch_api_2"]
    config:
      !Subprocess
      cmd: python
      args: ["combine.py"]
graph TD
    fetch1[Fetch from API 1] --> combine[Combine Results]
    fetch2[Fetch from API 2] --> combine

    style fetch1 fill:#bbf
    style fetch2 fill:#bbf
fetch_api_1 and fetch_api_2 run concurrently, then combine runs after both complete.
Cycle Detection
cdktr validates workflows at load time and rejects workflows with circular dependencies:
# INVALID: Creates a cycle
tasks:
  task_a:
    depends: ["task_b"]
    # ...
  task_b:
    depends: ["task_a"]  # ERROR: Cycle!
    # ...
Workflow Execution Lifecycle
1. Trigger
Workflows are triggered by:
- Scheduler: Cron schedule matches current time
- Manual:
cdktr task run <workflow>command - API: External system calls PrincipalAPI
2. Queuing
Triggered workflow is added to principal's task queue.
3. Assignment
Agent polls principal and receives workflow:
- Agent has available executor slots
- Workflow assigned to requesting agent
- Agent ID and workflow instance ID recorded
4. Execution
TaskManager executes workflow:
- Parse workflow DAG
- Identify root tasks (no dependencies)
- Execute tasks in topological order
- Wait for dependencies before starting each task
- Run independent tasks in parallel
5. Status Tracking
Agent reports status updates:
- PENDING: Workflow received, not started
- RUNNING: Workflow execution in progress
- COMPLETED: All tasks succeeded
- FAILED: One or more tasks failed
- CRASHED: Agent failed during execution
6. Completion
Final status and logs written to database.
Workflow Discovery
Workflows are discovered from the filesystem:
- Principal reads
CDKTR_WORKFLOW_DIR(default:./workflows) - All
.ymland.yamlfiles are parsed - Nested directories supported (creates namespaced workflow IDs)
- Invalid workflows logged but don't prevent startup
- Workflows refreshed periodically (every 60 seconds)
Workflow ID Generation
Workflow IDs are derived from file paths:
workflows/
  example.yml          → ID: "example"
  etl/
    daily.yml          → ID: "etl.daily"
    hourly.yml         → ID: "etl.hourly"
  data/
    ingestion/
      api.yml          → ID: "data.ingestion.api"
Task Execution Context
Working Directory
Tasks execute in the agent's current working directory.
Environment Variables
Tasks inherit the agent's environment variables.
Standard Output/Error
Task stdout and stderr are captured and stored in the database for later querying.
Exit Codes
- 0: Task succeeded
- Non-zero: Task failed
Task failure causes the workflow to fail, and dependent tasks are not executed.
Best Practices
- Keep Tasks Atomic: Each task should do one thing well
- Use Dependencies Wisely: Only declare necessary dependencies
- Enable Parallelism: Structure tasks to maximize parallel execution
- Handle Failures: Design workflows to be idempotent and retry-friendly
- Namespace Workflows: Use directories to organize related workflows
Next Steps
- Learn about ZeroMQ Communication
- Explore Workflow Definition in detail
- See Workflow Examples
Workflow Examples
Scheduled Task
Cron-based execution.
name: Database Backup
cron: "0 0 2 * * *"  # Daily at 2 AM
tasks:
  backup:
    name: Backup DB
    config:
      !Subprocess
      cmd: pg_dump
      args: ["-h", "db.example.com", "-f", "/backups/db.sql"]
Linear Pipeline
Sequential task execution.
name: ETL Pipeline
tasks:
  extract:
    name: Extract
    config:
      !Subprocess
      cmd: python
      args: ["extract.py"]

  transform:
    name: Transform
    depends: ["extract"]
    config:
      !Subprocess
      cmd: python
      args: ["transform.py"]

  load:
    name: Load
    depends: ["transform"]
    config:
      !Subprocess
      cmd: python
      args: ["load.py"]
Parallel Tasks
Multiple independent tasks.
name: Multi-Source Scraper
tasks:
  scrape_a:
    name: Scrape Source A
    config:
      !Subprocess
      cmd: python
      args: ["scrape_a.py"]

  scrape_b:
    name: Scrape Source B
    config:
      !Subprocess
      cmd: python
      args: ["scrape_b.py"]

  combine:
    name: Combine Results
    depends: ["scrape_a", "scrape_b"]
    config:
      !Subprocess
      cmd: python
      args: ["combine.py"]
UvPython with Dependencies
Managed Python execution with automatic dependency installation.
name: Data Analysis
tasks:
  analyze:
    name: Analyze Data
    config:
      !UvPython
      script_path: ./analyze.py
      packages:
        - pandas>=2.3.1,<3.0.0
        - matplotlib>=3.8.0
      working_directory: ./scripts
UvPython Project
For scripts with inline dependencies (PEP 723).
name: Report Generator
tasks:
  generate:
    name: Generate Report
    config:
      !UvPython
      script_path: ./generate_report.py
      is_uv_project: true
HTTP Webhook
Trigger external services.
name: Notify Slack
tasks:
  notify:
    name: Send Notification
    config:
      !Subprocess
      cmd: curl
      args:
        - -X
        - POST
        - https://hooks.slack.com/services/XXX
        - -d
        - '{"text":"Pipeline complete"}'

  validate_customers:
    name: Validate Customer Data
    depends: ["extract_customers"]
    config:
      !Subprocess
      cmd: python
      args:
        - scripts/validate.py
        - --input
        - /data/customers.csv

  transform:
    name: Transform and Join
    depends: ["validate_sales", "validate_customers"]
    config:
      !Subprocess
      cmd: python
      args:
        - scripts/transform.py

  load_warehouse:
    name: Load to Data Warehouse
    depends: ["transform"]
    config:
      !Subprocess
      cmd: python
      args:
        - scripts/load_warehouse.py

  update_reports:
    name: Update BI Reports
    depends: ["load_warehouse"]
    config:
      !Subprocess
      cmd: curl
      args:
        - -X
        - POST
        - https://bi.example.com/api/refresh
Example 3: Web Scraping
Multi-source web scraping with error handling.
name: News Scraper
description: Scrapes news from multiple sources
cron: "0 0 */6 * * *"  # Every 6 hours

tasks:
  scrape_source_1:
    name: Scrape TechCrunch
    config:
      !Subprocess
      cmd: python
      args:
        - scrapers/techcrunch.py

  scrape_source_2:
    name: Scrape Hacker News
    config:
      !Subprocess
      cmd: python
      args:
        - scrapers/hackernews.py

  scrape_source_3:
    name: Scrape Reddit
    config:
      !Subprocess
      cmd: python
      args:
        - scrapers/reddit.py

  deduplicate:
    name: Remove Duplicates
    depends: ["scrape_source_1", "scrape_source_2", "scrape_source_3"]
    config:
      !Subprocess
      cmd: python
      args:
        - scripts/deduplicate.py

  analyze_sentiment:
    name: Analyze Sentiment
    depends: ["deduplicate"]
    config:
      !Subprocess
      cmd: python
      args:
        - scripts/sentiment.py

  generate_digest:
    name: Generate Daily Digest
    depends: ["analyze_sentiment"]
    config:
      !Subprocess
      cmd: python
      args:
        - scripts/generate_digest.py

  send_email:
    name: Send Digest Email
    depends: ["generate_digest"]
    config:
      !Subprocess
      cmd: python
      args:
        - scripts/send_email.py
Example 4: Machine Learning Pipeline
Model training and deployment workflow.
name: ML Model Training
description: Train and deploy ML model
cron: "0 0 1 * * 0"  # Weekly on Sunday at 1 AM

tasks:
  fetch_training_data:
    name: Fetch Training Data
    config:
      !Subprocess
      cmd: python
      args:
        - ml/fetch_data.py
        - --days
        - "7"

  preprocess:
    name: Preprocess Data
    depends: ["fetch_training_data"]
    config:
      !Subprocess
      cmd: python
      args:
        - ml/preprocess.py

  train_model:
    name: Train Model
    depends: ["preprocess"]
    config:
      !Subprocess
      cmd: python
      args:
        - ml/train.py
        - --epochs
        - "100"

  evaluate:
    name: Evaluate Model
    depends: ["train_model"]
    config:
      !Subprocess
      cmd: python
      args:
        - ml/evaluate.py

  deploy:
    name: Deploy to Production
    depends: ["evaluate"]
    config:
      !Subprocess
      cmd: python
      args:
        - ml/deploy.py
        - --environment
        - production
Example 5: Monitoring and Alerting
System health check workflow.
name: Health Check
description: Check system health and alert on issues
cron: "0 */5 * * * *"  # Every 5 minutes

tasks:
  check_api:
    name: Check API Health
    config:
      !Subprocess
      cmd: curl
      args:
        - -f
        - https://api.example.com/health

  check_database:
    name: Check Database Connection
    config:
      !Subprocess
      cmd: psql
      args:
        - -h
        - db.example.com
        - -U
        - monitor
        - -c
        - SELECT 1;

  check_disk_space:
    name: Check Disk Space
    config:
      !Subprocess
      cmd: bash
      args:
        - -c
        - df -h / | awk 'NR==2 {if ($5+0 > 80) exit 1}'

  alert:
    name: Send Alert if Any Failed
    depends: ["check_api", "check_database", "check_disk_space"]
    config:
      !Subprocess
      cmd: python
      args:
        - scripts/send_alert.py
Example 6: Report Generation
Generate and distribute reports.
name: Weekly Sales Report
description: Generate weekly sales report
cron: "0 0 9 * * 1"  # Monday at 9 AM

tasks:
  query_data:
    name: Query Sales Data
    config:
      !Subprocess
      cmd: python
      args:
        - reports/query_sales.py
        - --period
        - last_week

  generate_charts:
    name: Generate Charts
    depends: ["query_data"]
    config:
      !Subprocess
      cmd: python
      args:
        - reports/generate_charts.py

  create_pdf:
    name: Create PDF Report
    depends: ["generate_charts"]
    config:
      !Subprocess
      cmd: python
      args:
        - reports/create_pdf.py

  email_report:
    name: Email Report to Team
    depends: ["create_pdf"]
    config:
      !Subprocess
      cmd: python
      args:
        - reports/email_report.py
        - --recipients
        - team@example.com
Next Steps
- Review YAML Structure for details
- Learn about Task Configuration
- Explore Scheduling options
- Understand Task Dependencies
Logs & Database
The logging and data persistence system in cdktr is designed to provide comprehensive visibility into workflow execution while maintaining performance and reliability. This architecture enables both real-time monitoring and historical analysis through a combination of streaming and storage mechanisms.
Log Streaming Architecture
At the heart of cdktr's observability is a publish-subscribe logging system built on ZeroMQ. This architecture creates a real-time stream of execution information that flows from agents executing tasks, through the principal coordinator, and out to any interested consumers.
How Agents Publish Logs
When an agent executes tasks, it doesn't write logs to local files or directly to a database. Instead, each agent maintains a log publisher that sends messages to the principal over a dedicated ZeroMQ connection. This publisher uses a PUSH socket that connects to the principal's log manager, which listens on a PULL socket.
Every log message contains rich context about the execution:
- The workflow identifier and name
- The specific workflow instance being executed
- The task name and its unique execution identifier
- A timestamp marking when the event occurred
- The log level (INFO, WARN, ERROR, etc.)
- The actual log payload containing the message
This structured approach ensures that every log line can be traced back to its exact origin in the execution tree. When you're troubleshooting a failed task, you can immediately see which workflow instance it belonged to and when it occurred.
The Principal's Log Manager
The principal runs a dedicated log manager service that acts as a central hub for all logging activity. This service receives log messages from all agents via its PULL socket and immediately republishes them through a PUB socket. This publish-subscribe pattern creates a broadcast mechanism where multiple consumers can receive the same log stream simultaneously.
The log manager doesn't process or filter the messages—it simply ensures they flow from agents to subscribers. This design keeps the critical path lightweight and fast. The manager operates on two ports configured via environment variables: one for receiving logs from agents (CDKTR_LOGS_LISTENING_PORT) and another for publishing to subscribers (CDKTR_LOGS_PUBLISHING_PORT).
Real-Time Log Consumption
Any component can subscribe to the log stream by connecting to the principal's publishing port. The Terminal User Interface (TUI), for example, leverages this exact mechanism to provide live log tailing. When you select a workflow in the TUI and watch its logs scroll by, you're seeing the same messages that agents are publishing in real-time.
Subscribers can filter logs by workflow ID, allowing them to see only the logs relevant to specific workflows. This topic-based subscription means you're not overwhelmed with logs from every workflow running in your system—you see exactly what you choose to monitor.
The streaming nature of this system provides immediate feedback during execution. There's no delay waiting for logs to be written to disk, no polling interval to wait for—you see task output as it happens.
Log Persistence with DuckDB
While streaming provides real-time visibility, you also need the ability to query historical execution data. This is where DuckDB enters the picture, providing a lightweight yet powerful analytical database for storing all workflow execution information.
Why DuckDB?
DuckDB is an embedded analytical database—think of it as SQLite but optimized for analytical queries rather than transactional workloads. For cdktr's use case, this is ideal. You get the simplicity of an embedded database (no separate server to manage) combined with excellent performance for querying large volumes of log data.
The database can run in-memory for development and testing, or persist to disk for production deployments. This flexibility allows you to choose the appropriate storage strategy for your environment.
DuckDB is just great! Given your cdktr DB is just a single file, you can even open it directly with DuckDB's CLI or connect to it from Python or R for custom analysis.
The Log Persistence Pipeline
The principal runs a dedicated log persister service that subscribes to the same log stream as other consumers. This service receives logs from the pub/sub system and batches them for efficient database insertion. Rather than writing each log individually, the persister accumulates messages in an asynchronous queue and flushes them to the database every 30 seconds.
This batching strategy significantly improves write performance. Database insertions are one of the more expensive operations, and batching reduces the overhead by consolidating many individual writes into a single efficient bulk operation.
If a database write fails—perhaps due to disk space issues or connection problems—the persister retains the failed batch in its queue and attempts to write it again on the next interval. This resilience ensures logs aren't lost even when the database experiences temporary issues.
The Logstore Schema
All log messages are stored in the logstore table with a straightforward schema that mirrors the log message structure:
- workflow_id: The identifier for the workflow definition
- workflow_name: The human-readable workflow name
- workflow_instance_id: The unique identifier for this execution instance
- task_name: The name of the task that generated the log
- task_instance_id: The unique identifier for this task execution
- timestamp_ms: Milliseconds since epoch for precise time ordering
- level: The log level (INFO, WARN, ERROR, etc.)
- payload: The actual log message content
This schema enables powerful queries. You can retrieve all logs for a specific workflow instance, find all ERROR-level logs across all executions, or analyze task performance by examining timestamp patterns. The database provides a QueryLogs API that accepts time ranges, workflow filters, and instance filters to retrieve exactly the logs you need.
Workflow Execution State
Beyond just log messages, cdktr persists all workflow execution state in the database. This creates a complete audit trail of everything that happens in your system.
Insert-Only Architecture
A critical design decision is that all execution state is stored in insert-only tables. Nothing is ever updated or deleted. When a workflow starts, a record is inserted. When it completes, another record is inserted with a new timestamp. The same applies to individual tasks—each status change creates a new row.
This approach provides several advantages:
- Complete History: You can reconstruct the entire timeline of any workflow execution by querying its status records chronologically
- Audit Trail: Nothing is ever lost or overwritten, providing perfect auditability
- Performance: Append-only operations are faster than updates, especially in analytical databases like DuckDB
- Simplicity: No need for complex update logic or handling concurrent updates
Workflow Run Status
The workflow_run_status table tracks workflow-level state changes:
- workflow_id: The workflow definition identifier
- workflow_instance_id: The unique instance identifier
- status: One of PENDING, RUNNING, WAITING, COMPLETED, FAILED, or CRASHED
- timestamp_ms: When this status change occurred
When an agent starts executing a workflow, it inserts a RUNNING status record. When the workflow completes (successfully or not), another record is inserted with the appropriate final status. By querying the most recent status for a workflow instance, you can determine its current state. By querying all statuses, you can see its complete execution timeline.
Task Run Status
Similarly, the task_run_status table maintains the execution history for individual tasks:
- task_id: The task identifier from the workflow definition
- task_instance_id: The unique identifier for this task execution
- workflow_instance_id: The workflow instance this task belongs to
- status: The task's status (PENDING, RUNNING, COMPLETED, FAILED, etc.)
- timestamp_ms: When this status change occurred
This granular tracking means you can analyze task-level behavior. Which tasks fail most often? How long does a particular task typically run? Which tasks are bottlenecks? All these questions can be answered by querying the task status history.
Querying Execution History
The principal provides API endpoints for querying this execution data. You can retrieve recent workflow statuses to see what's currently running or recently completed. The log query endpoint allows time-based and filter-based retrieval of both logs and status records.
The TUI and CLI tools leverage these APIs to present execution information to users. When you see a workflow's status in the TUI or query logs with the CLI, you're seeing data pulled directly from these DuckDB tables.
Benefits of This Architecture
The combination of real-time streaming and persistent storage provides the best of both worlds:
Immediate Visibility: The pub/sub streaming means you see what's happening right now, with no delay. This is essential for monitoring long-running workflows and troubleshooting issues as they occur.
Historical Analysis: The DuckDB storage enables sophisticated queries over historical data. You can identify patterns, generate reports, and understand long-term trends in your workflow execution.
Decoupled Consumers: Because logging uses pub/sub, new consumers can be added without impacting agents or the principal. Want to send logs to an external monitoring system? Just add a new subscriber.
Resilience: Agents buffer logs locally if they can't reach the principal, the persister retries failed database writes, and the streaming continues even if persistence fails. The system is designed to preserve observability even when components experience issues.
Scalability: The streaming architecture scales horizontally—more agents just means more log publishers, and subscribers receive all messages regardless of how many agents are active. The database scales vertically with DuckDB's efficient analytical engine handling large query workloads.
This logging and persistence architecture ensures you always have the information you need to understand, monitor, and troubleshoot your distributed workflow executions.
The TUI (Terminal User Interface)
cdktr includes a powerful Terminal User Interface (TUI) built with Ratatui, providing real-time monitoring and management of workflows without requiring a web browser.
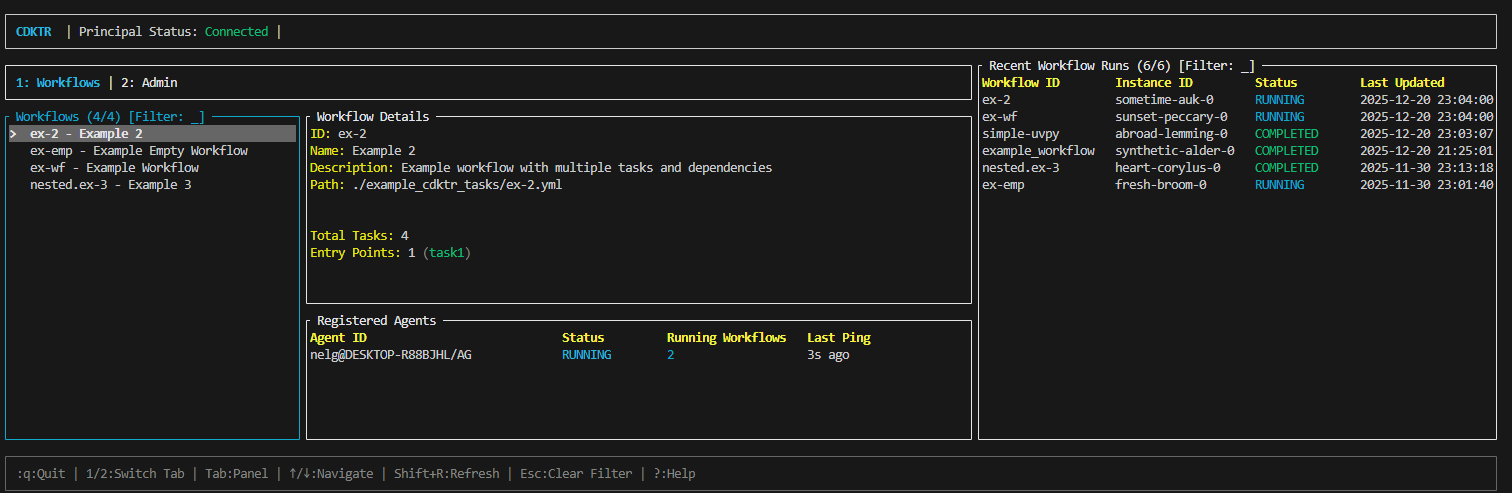
Features
- Workflow Management: View all workflows and their schedules
- Real-time Monitoring: Watch workflow execution in real-time
- Agent Status: Monitor registered agents and their health
- Manual Triggers: Run workflows on-demand with a keypress
- Log Viewing: Browse execution logs directly in the terminal
- Keyboard Navigation: Efficient keyboard-driven interface
Launching the TUI
To start the TUI, ensure you have a principal running that you can connect to, then run:
cdktr ui
Quick Navigation
↑↓orjk- Navigate listsr- Run selected workflowq- QuitTab- Switch between panels?- Show help
Sections
- Overview - What the TUI provides
- Navigation - How to navigate
- Workflow Management - Managing workflows
- Monitoring - Viewing execution status
- Agent Management - Agent information
Overview
Navigation
Workflow Management
Monitoring
Agent Management
CLI Reference
The cdktr command-line interface provides commands for managing principals, agents, workflows, and logs.
Command Structure
cdktr <command> [subcommand] [options]
Available Commands
ui
Launch the Terminal User Interface.
cdktr ui [--principal-host HOST] [--principal-port PORT]
See TUI Chapter for details.
start
Start a principal or agent instance.
cdktr start <principal|agent> [OPTIONS]
See Start Commands for details.
task
Manage and trigger workflows.
cdktr task <run|list> [OPTIONS]
See Task Commands for details.
logs
Query execution logs.
cdktr logs query [OPTIONS]
See Logs Commands for details.
init
Initialize a new cdktr project.
cdktr init [PATH]
See Init Command for details.
Global Options
--help, -h
Show help information.
cdktr --help
cdktr start --help
cdktr task run --help
--version, -V
Show version information.
cdktr --version
Environment Variables
Many CLI options can be set via environment variables:
CDKTR_PRINCIPAL_HOST- Default principal hostCDKTR_PRINCIPAL_PORT- Default principal portCDKTR_LOG_LEVEL- Log verbosity (DEBUG, INFO, WARN, ERROR)CDKTR_WORKFLOW_DIR- Workflow directory pathCDKTR_DB_PATH- Database file path
Examples
Start a complete setup
# Terminal 1: Start principal
cdktr start principal

# Terminal 2: Start agent
cdktr start agent

# Terminal 3: Open TUI
cdktr ui
Trigger a workflow
cdktr task run my-workflow
Query logs
cdktr logs query --workflow my-workflow --status FAILED
Next Steps
Task Commands
Start Commands
Logs Commands
Init Command
Advanced Topics
This chapter covers advanced cdktr features and deployment patterns for production use.
Topics
Fault Tolerance
Learn how cdktr handles failures:
- Agent crash recovery
- Principal restart behavior
- Workflow crash detection
- Heartbeat monitoring
Concurrency Control
Optimize workflow execution:
- Agent concurrency limits
- Task parallelism
- Resource management
- Performance tuning
Performance Tuning
Maximize cdktr performance:
- Optimization strategies
- Bottleneck identification
- Scalability patterns
- Benchmarking
Security Considerations
Secure your cdktr deployment:
- Network security
- Access control
- Firewall configuration
- Future authentication features
Production Deployment
For production deployments, consider:
- High Availability: Run principal with monitoring and auto-restart
- Load Distribution: Deploy multiple agents across machines
- Network Security: Use VPN or firewall rules
- Monitoring: Implement external monitoring of principal and agents
- Backup: Regular database backups
- Logging: Centralized log collection
Best Practices
- Start with conservative concurrency limits
- Monitor resource usage continuously
- Use distributed setup for reliability
- Implement proper error handling in workflows
- Test workflows thoroughly before deploying
- Keep cdktr updated to latest version
Next Steps
Explore each advanced topic for detailed information on production deployment and optimization.